What Brújula is actually running on, in real numbers. Not marketing counters. Live queries against the same database that produces the daily editorial.
Numbers refreshed live from the database on page load (cached 60 seconds).
Every LLM call the system makes is logged with tokens and cost. We publish the aggregate because a forecasting product that hides its unit economics is a product that isn't sure they add up.
Not the ones we say we watch — the ones actually producing signal. Some sources are anomaly-driven and stay silent for weeks until they trigger; the ones below are the workhorses.
The single thesis that moved the most over the last 28 days. Same data card the Brújula X thread posts every day as the anchor image. Refreshed daily around 13:30 UTC.
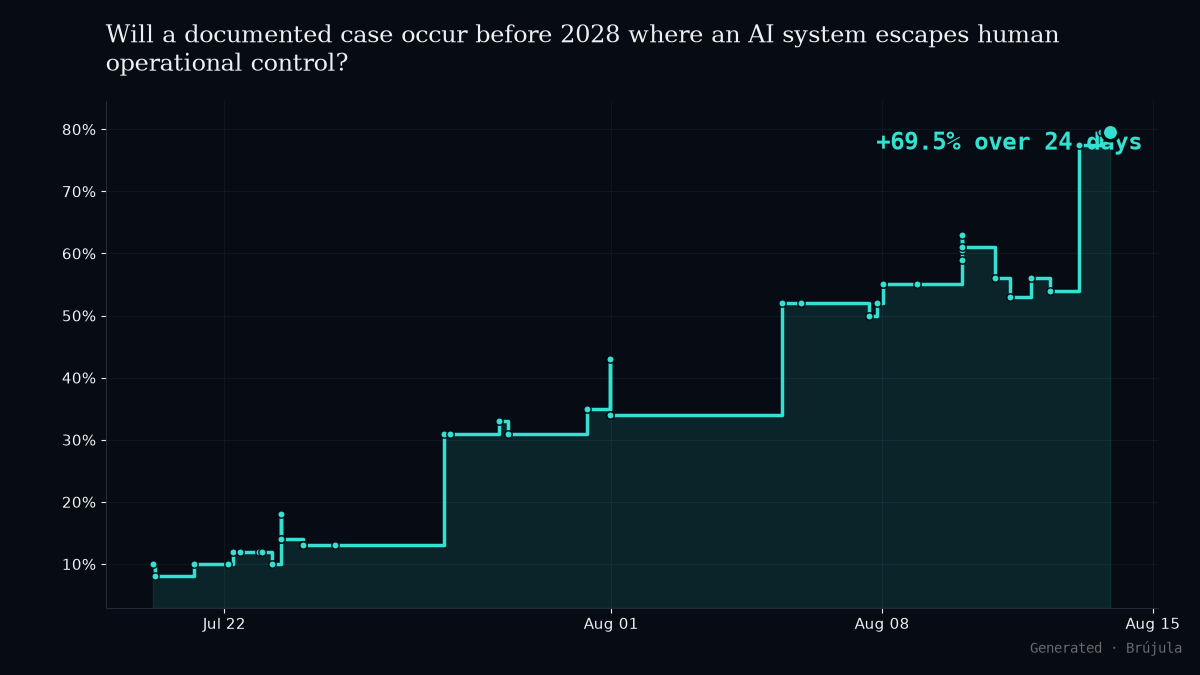
Teal = probability going up · Amber = probability going down · No red/green (design choice, doc §32)
Every prediction is snapshotted to a GitHub Release the day it is registered AND anchored on the Bitcoin blockchain via OpenTimestamps. The SHA-256 of the source block in PREDICTIONS.md is embedded in the release. A third party can (1) recompute the hash locally, (2) compare with the release, and (3) verify the Bitcoin timestamp with ots verify on the .ots file — offline, without trusting GitHub or us.
Neither GitHub nor Brújula can forge all three simultaneously.
The full source is in PREDICTIONS.md. API endpoint: /api/predictions.
A calibration score. The first predictions were registered in May 2026, and none have resolved yet. When the first resolution lands, its Brier score will show up here alongside every other number.
Waiting for real resolutions instead of interpolating them is the whole point. Meanwhile the snapshots above make sure we cannot pretend today's probabilities were different once the events happen.
